Learn how to use the MHS Group Insights App. Get documentation, tutorials, and more!
What is Generating a Report
Introduction to Local and National Norms
Prior to report generation, the following information is required to score the Naglieri General Ability Tests:
Test Type
The specific test(s) completed by the students (i.e., Naglieri–V and/or Naglieri–NV and/or Naglieri–Q).Date Range
The date range in which the students completed the tests (e.g., September 15 to October 9, 2021).Grade
The grade form completed by the students (e.g., Grade 2).
Norm Type
The Naglieri General Ability Tests can be scored using either national or local norms. Selecting National Norms will compare students to a nationally representative sample of same-grade peers, and their scores will be calculated in comparison to the national reference sample of students who have completed the Naglieri General Ability Tests. Selecting Local norms will score students as compared to their grade-peers from a specified school, subdistrict (group of schools), or district.Report Data By
This selection determines which students will appear in the report.Local Norms – The Report Data By selection will have a direct impact on the scores calculation as students’ scores are computed in relation to the specified Report Data By sample selection.
National Norms – The Report Data By selection will define which students appear in the report but does not impact the calculation of scores.
School
Local Norms – The scores each student earned in relation to same-grade peers within the selected school.National Norms – The scores of the students who belong to the school selected.
Subdistrict
Local Norms – The scores each student earned in relation to same-grade peers within the selected subset of the district.National Norms– The scores of the students who belong to the subdistrict selected.
District
Local Norms – The scores each student earned in relation to same-grade peers within the selected district.National Norms – The scores of the students who belong to the district selected.
How to generate a new report
- Click the Manage Reports icon in the left navigation menu.
- Click + New Report. The report form opens up.
- Enter a unique Report Name into the applicable field. You can refer to this name if you need to search your report list.

- Select the Test Type(s) you want to include.
Please select all test types you wish to include. You can include just one test type, a combination of two test types, or all three.A Total Score can only be calculated if two or three tests are selected.

- Select the Completed Date Range you want the report to include.

- For the start and end date, click OK to confirm the selected date

- Select the Grade. This will filter your student roster to include only the students who are in that selected grade.

- Select the Norm Type from the list of options (National Norms or Local Norms)

- Select Report Data By from the list of options (School, District, Subdistrict, School+ District, School+ Subdistrict). For Local Norms, this selection will define the local comparison sample and which students appear in your report.
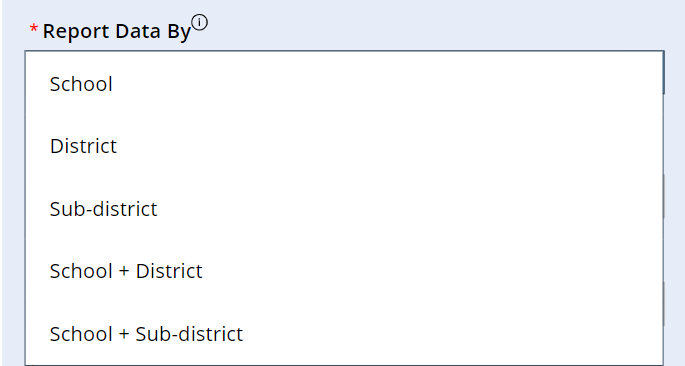
For National Norms, this selection will define which students appear in your report.

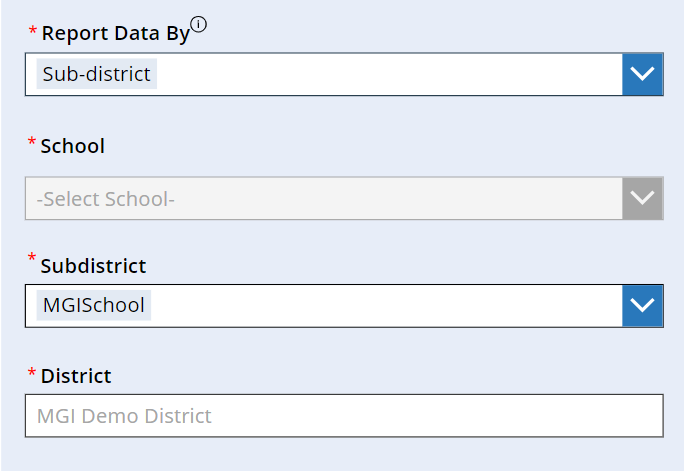
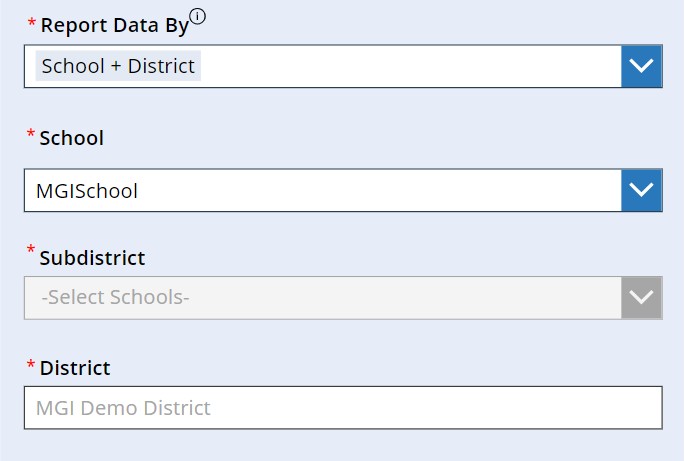
- Make your selections from the next three dropdown menus (School, Subdistrict, District). Note that these dropdown menus—and the options within—may or may not be enabled depending on the Report Data By option you selected in the previous step.
School– Select the school you wish to see in your report.
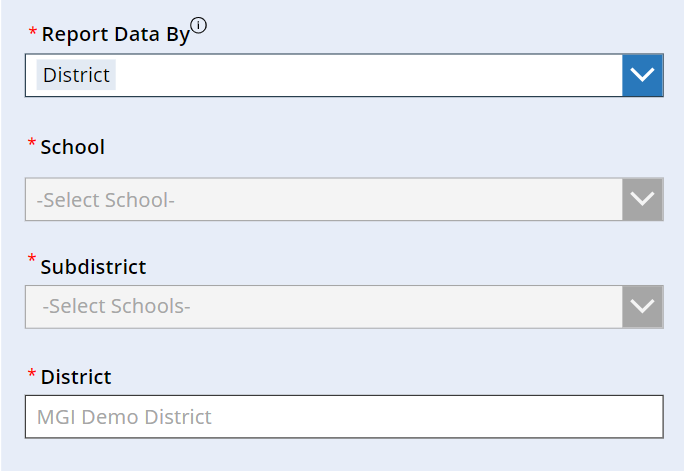

District– The district is already selected for your District comparison.

Sub-district– Select the schools you wish to include in your Subdistrict.
School + District – Select the school you wish to see in your report. The district is already selected for your District level comparison.
School + Sub-district – Select the school you wish to see in your report. Select the schools you wish to include in your Subdistrict. Selected school must be included in Sub-district.

- Click Next. A Report Summary appears, with a list detailing the selections you made on the previous screen.

- Review the selections you have made. To make changes, click Back. If everything is okay, click Generate.

- You will be taken back to the Manage Reports page. The generated report will appear at the top of the table. To open the report, click the Excel or CSV link, depending on the format you want.
Note: While all scoring options are included in your report, for local norms we recommend using the following scoring options based on the number of completed records:
- 25+ records: All Scoring Options
- 10-24 records: Local Rank Order/Local Percentile Rank
- <10 records: Local Rank Order
How to open a generated report
- Click the Manage Reports icon in the left navigation menu.
- In the report table, select the report format (Excel and/or CSV) you want to use. The report type you select will open in a new browser window.
- Save the report to your device.
How to search for a generated report
- Click the Manage Reports icon in the left navigation menu.
- Enter the report name into the search box.
- Click the search icon.
Report Tutorials
Report Elements
The Local Norms Report and National Norms Report can be opened in either an Excel file or a .csv file. The sections include the following content:
Legend
Description of the scores provided on the other tabs.Summary
Includes a brief description of the report and information about the sample of students selected.Student Information
Demographic information of each student.
Response Style Analysis
Provides metrics related to whether the student has provided reliable and usable data. These include Completion Time, Omitted Items, Identical Consecutive Responses, and Inconsistent Responses, and indicates if any of these metrics are flagged for an unusual response style. See chapter 4, Scores and Interpretation, in the Technical Manual for more details about these Indicators).
Additional Information:
Provides additional details about the student’s testing session and includes the number of items attempted by the student (maximum = 40), if the student timed out of the test (i.e., the student did not attempt all test questions within the time limit), and the date the test was completed.
Raw Scores
Provides the total number of correctly answered items correct on each test completed (with the discontinue rule applied; see Naglieri General Ability Tests’ Scores in chapter 4, Scores & Interpretation, in the Technical Manual).
Local Norm Scores–School-Level Comparisons (if selected): Provides the score options for a school-level comparison (i.e., what score each student earned in relation to all same-grade peers within the school).
Local Norm Scores–Subdistrict -Level Comparisons (if selected): Provides the score options for a subdistrict-level comparison (i.e., what score each student earned in relation to all same-grade peers within the schools selected to be part of the subdistrict sample).
Local Norm Scores–District-Level Comparisons (if selected): Provides the score options for a district-level comparison (i.e., what score each student earned in relation to all same-grade peers within the district sample).
National Norm Scores (if selected): Provides the scores for a grade-based national comparison (i.e., what score each student earned in relation to a nationally representative sample of same-grade peers).
Item Scores
The student’s score for each item (i.e., correct or incorrect).
Understanding the Local Norms Sample
It is important to keep in mind that the composition of the local norm sample has a direct impact on the interpretation of the Local Norm Scores. Each student’s Local Norm Score is obtained by comparing their Raw Score to the scores obtained by students in the selected local norm sample (see chapter 4, Scores and Interpretation, in the Technical Manual for more information about how these scores are calculated and can be used). For this reason, it is important to ensure that all students within the selected grade have completed testing before the Local Norms Report is generated. Adding or removing one or more students in the local norm sample will affect the Local Norm Scores of all students within that report. Additionally, a student’s Local Norm Scores based upon individual schools will likely be different than their Local Norm Scores based upon a school district.
Best Practices for Local Norms
National and Local Norms
Equitable representation is influenced by the content of the tests used in the identification process (Naglieri & Otero, 2014), how the tests are used (Peters & Engerrand, 2016), and the definition of gifted and talented students. According to the National Association for Gifted Children (NAGC; 2019), “students with gifts and talents perform—or have the capability to perform—at higher levels compared to others of the same age, experience, and environment in one or more domains.” Comparing students to their peers of the same age or grade can be accomplished by using national or local norms. A national norm is created using a large sample of students who match the demographic makeup (e.g., in terms of age, sex/gender, race, ethnicity, parental educational level [a measure of socioeconomic status], and urban/rural settings) of that country (AERA, APA, & NCME, 2014). A student’s test performance is then compared to the test performance of students from that national norm. In a local norm, however, a student is compared to their peers in the school or school district. This scenario means the comparison group is more closely representative of the local community and its unique demographic makeup.
Most local norms compare a student to all students within the same grade in the same school, subdistrict (a subset of the district [e.g., Title I schools vs. Non-Title I schools]), or entire school district. This comparison represents the standing of a student to the local community. That is, the reference group is not limited in any way (e.g., only gifted students). “Local norms are often useful in conjunction with published norms, especially if the local population differs markedly from the population on which published national norms were based. In some cases, local norms may be used exclusively” (American Educational Research Association [AERA], American Psychological Association [APA], and National Council on Measurement in Education [NCME], 2014, p. 196). The Naglieri General Ability Tests allows Assessment Coordinators to generate both local and national norms so that decisions can be made in alignment with the local definition of gifted and talented and the needs of the individual school district.
When generating a Local Norms Report, the composition of the local comparison group is important. First, the sample used to create a local norm should be reasonably large (i.e., greater than 100 students) to ensure variability in responses, and second, it should adequately represent the local demographics. The local norm should also be inclusive and based on universal assessment of all students within a grade, not just those who have been previously screened in any way (e.g., a rating scale or teacher recommendation). For example, if the goal is to have a local norm for Grade 2 students, then all Grade 2 students should be tested.
The composition of the local norm sample can have a large impact on a student’s Local Percentile Rank, Local Stanine, Local Standard Score, and Total Local Score. Consider a local norm sample based solely on a group of students already in a profoundly gifted program. A small number of these students will obtain a Below Average score (less than the 15th percentile; see the figure below) in this sample; however, if these same students were compared to a local norm sample that included non-gifted students, they would all likely have a score in the Very Much Above Average range (above the 98th percentile). This difference in Local Percentile Rank is because Local Norm Scores are always relative to the other students in the sample. Therefore, it is strongly recommended that those interpreting these scores take note of who is included in the sample, especially when interpreting low scores on these tests.
Comparison of Score Types and Corresponding Categories
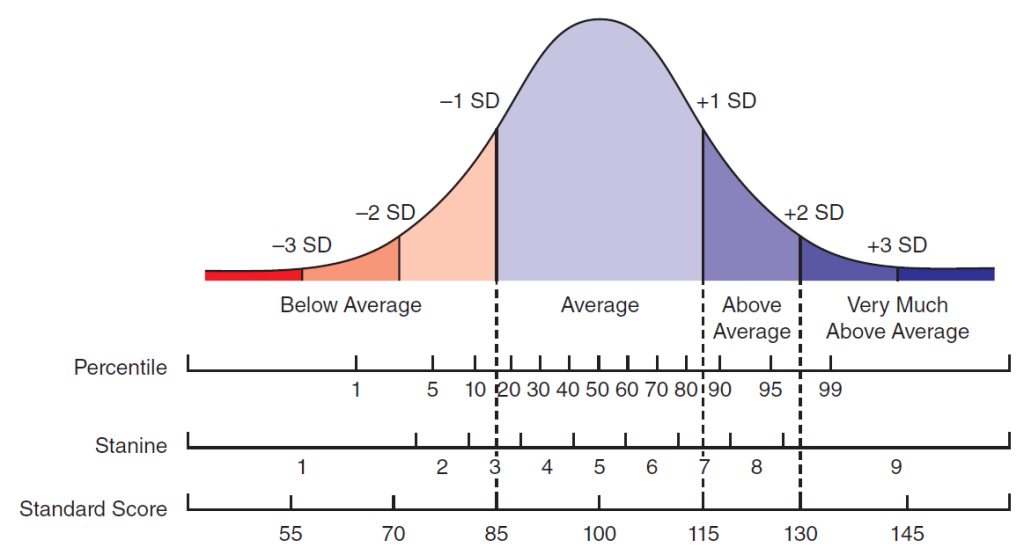
A student’s Local Norm Scores can be different when they are based upon an individual school, subdistrict, or district comparison. School-level Local Norm Scores indicate what score a student achieved in relation to the local school’s population, while subdistrict-level Local Norm Scores indicate what score a student achieved in relation to the population of a group of schools. The group of schools selected to comprise a subdistrict-level local norm generally include schools with a similar demographic makeup, such as Title I or Non-Title I schools grouped to define a subdistrict-level Local Norm. District-level Local Norms Scores indicate what score a student achieved in relation to the local district’s population as a whole. When a school or group of schools is more diverse or does not have the same representation as the district, then it can be more useful to examine the individual school or subdistrict norms to ensure a fair comparison of a student to their peers. In contexts where the school, subdistrict, or district’s population is diverse compared to national norms, local norms are useful for comparing a student’s score to one that more closely reflects students in the local community of learners.
The larger the local norm sample, the more precise the Local Percentile Rank, Local Stanine, Local Standard Score, and Total Local Scores will be. Ideally, minimum sample sizes should be about 100 students to calculate the Local Percentile Ranks, Local Stanines, Local Standard Scores, and Total Local Scores. When samples are smaller, it is recommended that the Local Rank Order be used, as it is unaffected by sample size.
The Naglieri General Ability Tests provide grade-based national norms for Kindergarten through Grade 5 computed by comparing a student to a nationally representative sample of students across the United States. National norms have the utility of comparing scores to a large sample size and are not dependent on the number of students or relative scores of the students tested locally. The National Norm Scores are calculated based on the grade of the student, and for Kindergarten and Grade 1, grade and age of the student, as these grade-levels include two distinct normative groups to reflect the moderate variability in ability with grade-peers in the younger students (see Table 4.1). Scores for students whose ages are outside of the typical range for a grade should be interpreted with caution, as the normative sample may not reflect their peers. See chapter 5, Development for detailed information on the normative grade groups.
Normative Groups for National Norms: Grades and Age Ranges
|
Normative Group |
Grade and Age Range |
|
Kindergarten–Lower |
Enrolled in Kindergarten and 4 years 8 months to 6 years 1 month |
|
Kindergarten–Upper |
Enrolled in Kindergarten and 6 years 2 months to 7 years 10 months |
|
Grade 1–Lower |
Enrolled in Grade 1 and 6 years 3 months to 7 years 2 months |
|
Grad 1–Upper |
Enrolled in Grade 1 and 7 years 3 months to 8 years 11 months |
|
Grade 2 |
Enrolled in Grade 2 and 5 years 0 months to 9 years 11 months |
|
Grade 3 |
Enrolled in Grade 3 and 6 years 0 months to 10 years 11 months |
|
Grade 4 |
Enrolled in Grade 4 and 7 years 0 months to 11 years 11 months |
|
Grade 5 |
Enrolled in Grade 5 and 8 years 0 months to 12 years 11 months |
Types of Scoring Options
Raw Scores
A Raw Score is the sum of the questions answered correctly on a specific test (e.g., the Naglieri–V test) and the starting point for any test interpretation. This score is computed by counting all the items answered correctly, up to the point where the discontinue rule is met (i.e., when four consecutive items have been answered incorrectly). A discontinue rule reduces measurement error that may occur when using a multiple-choice test format. For example, if five response options are provided, there is a 20% chance that a student can choose the correct answer by guessing. The discontinue rule reduces the measurement error caused by guessing on items that are too hard for the student to answer (i.e., those items above the point where the discontinue rule was met). There is no penalty for wrong answers. The higher the Raw Score, the better the student’s performance on the test. Raw Scores can be used to create other types of scores, including Local Rank Order, Percentile Rank, Stanine, and Standard Score.
Local Rank Order
When the Raw Scores are ranked in comparison to other students in the school or district as specified by the Assessment Coordinator, this metric is referred to as a Local Rank Order. The Local Rank Order is used to describe the relative standing of a student’s Raw Score within a local norm sample that consists of same-grade peers who have taken the same test (e.g., the Naglieri–Q). The lower the Local Rank Order, the better the student’s performance on the test. Each student’s Raw Score is given a rank between 1 (which denotes the highest Raw Score) and a figure indicating the lowest Raw Score based on the number of students within the selected local norm sample. For example, in a local norm sample that consists of 60 Grade 3 students within the same school, each student’s Raw Score would be ranked highest to lowest on a Local Rank Order of 1 to 41. Note that students with the same Raw Score will be given the same Local Rank Order (e.g., if three students have a raw score of 30, and 30 is the highest score in the local norm sample, then all three students will have a Local Rank Order of 1).Percentile Rank
A Percentile Rank describes a student’s performance relative to that of other students. This score ranges from 1 to 99 (note that in order to differentiate the very top of the distribution, scores of 99.0 to 99.4 are denoted as 99, while scores ≥ 99.5 are denoted as “>99”).
- For Local Norm Scores this indicates the percentage of students in the local norm sample who obtained a Raw Score that was the same or lower than the Raw Score obtained by the student. For example, if a student has a Local Percentile Rank of 90, this score indicates that the student earned a Raw Score that was equal to or greater than 90% of students in the local norm sample.
- For the National Norm Scores this indicates the percentage of students in the national norm sample who obtained a Standard Score that was the same or lower than the Standard Score obtained by the student. If a student has a National Percentile Rank of 85, this score indicates that the student earned a Standard Score that was equal to or greater than 85% of their grade-peers in the National Norm Sample.
The higher the Percentile Rank, the better the student’s performance on the test.
Stanine
A Stanine categorizes relative ranking into nine broad categories. Similar to the Percentile Rank, Stanines are derived from the norm sample selected (i.e., local or national).
- For the local norms, Stanines are a direct transformation of the Local Percentile Ranks obtained from students of the same grade within the local norm sample.
- For the national norms, Stanines are calculated by transforming the National Percentile Rank from students of the same grade within the national norm sample.
Stanines have a mean of 5 and a standard deviation of 2. Stanines between 4 and 6 are considered within the average range, while scores as low as 1 or as high as 9 occur more rarely and denote extremely low or high performance, respectively. Stanines, while not as granular as Percentile Ranks or Standard Scores, can be used as simple categories to broadly classify students. The higher the Stanine, the better the student’s performance on the test.
Standard Score
A Standard Score describes the distance a student’s score is above or below the average score of the norm sample on the test.
- For the local norms, this is based on a comparison between a student’s Percentile Rank and the Percentile Ranks obtained from students of the same grade within the local norm sample. The Local Standard Scores are calculated based on a conversion from the empirically derived Local Percentile Ranks. These percentile ranks can be converted to their corresponding theoretical standard scores.
- For the national norms, this is based on a linear transformation of the national norm sample. The National Standard Scores are calculated based on a conversion from the Raw Score.
For the Naglieri General Ability Tests, the Standard Scores are standardized to a mean of 100 and a standard deviation of 15. The higher the Standard Score, the better the student’s performance on the test.
Standard Scores are better suited for comparing performance across Naglieri–V, Naglieri–NV, and Naglieri–Q test scores than Percentile Ranks. In general, Percentile Ranks are useful for comparing an individual student to other students of the same grade in the norm sample. However, although Percentile Ranks are often used in education, it is important to understand that these scores should not be used in any mathematical calculations because differences in Percentile Ranks are not equivalent across the full range of scores. For example, the 20-point difference between a 50th and 70th Percentile Rank corresponds to Standard Scores of 100 and 108, while the 20-point difference between a 70th and 90th Percentile Rank corresponds to Standard Scores of 108 and 119.
Confidence Intervals
All measurements contain some error. Measurement error in the Naglieri General Ability Tests is described in terms of the confidence interval. Confidence intervals take measurement error into account, providing, at a specific level of probability (usually 90% or 95%), a range of scores within which the true Naglieri General Ability Tests score is expected to fall (Harvill, 1991). That is, if an individual was evaluated 100 times and a 95% confidence interval was created each time, then 95 of those 100 confidence intervals would be expected to contain their true score. The width of the confidence interval indicates the precision of the estimate; more confidence can be placed in estimates with narrow confidence intervals than in those with wide confidence intervals (Morris & Lobsenz, 2000). A less reliable standard score (i.e., one with a greater error in measurement) will have a wider confidence interval than more reliable scores. True-score 95% confidence level is used for the Naglieri General Ability Tests national norms, with calculations based on each test’s standard error of measurement (SEM; Nunally, 1978). For example, if a grade 2 student’s standard score was 90 on the Naglieri–V, the Assessment Coordinator can be quite confident that the student’s true Standard Score falls within the range of 82–100.Total Score
The Total Score for the Naglieri General Ability Tests is based on the combination of the Naglieri–V, Naglieri–NV, and Naglieri–Q test scores. When a student has completed all three tests, a Total Score based on all three tests can be computed. When a student has completed only two tests, a Total Score can still be computed based on the two-test combination to derive a composite score.- For the local norms, a Total Local Standard Score is provided. This score is derived from the distribution of the sum of their constituent Local Standard Scores. The higher the Total Local Standard Score, the better the student’s performance on the test.
References
American Educational Research Association, American Psychological Association, & National Council on Measurement in Education (Eds.). (2014). Standards for educational and psychological testing. American Educational Research Association.
Naglieri, J. A., & Otero, T. M. (2011). Assessing diverse populations with nonverbal measures of ability in a neuropsychological context. In C. R. Reynolds & E. Fletcher-Janzen (Eds.), Handbook of clinical child neuropsychology (pp. 227–234). Springer.
National Association for Gifted Children. (2019). Position Statement: A Definition of Giftedness that Guides Best Practice. Retrieved from https://www.nagc.org/sites/default/files/Position%20Statement/Definition%20of%20Giftedness%20%282019%29.pdf
Nunnally, J. C. (1978). Psychometric theory (2nd ed.). McGraw-Hill.
Peters, S. J., & Engerrand, K. G. (2016). Equity and Excellence: Proactive Efforts in the Identification of Underrepresented Students for Gifted and Talented Services. Gifted Child Quarterly, 60(3), 159-171. https://doi.org/10.1177/0016986216643165